
You’ve probably heard this before: “Why put money in property? Fixed deposits, mutual funds or stocks give better returns. Property CAGR is too low.”
On the surface, that sounds reasonable. If you only look at headline growth rates, real estate does appear to lag behind other asset classes.
But here’s the truth: real estate returns are not defined by CAGR alone.
Residential property has its own wealth-building mechanics. When you leverage wisely (through a home loan), plan your cash flows, and exit with discipline, even moderate price growth can compound into strong, equity-level returns.
In this guide, we’ll walk through how real estate really creates value and how you can structure your investment to get those returns without speculation or complexity.
Why Are Most Real Estate ROI Discussions Misleading?

If you’ve ever searched “real estate ROI” or “property returns in Bangalore”, you’ll find the same advice repeated: “Buy low, sell high.” That oversimplifies how real estate investment returns are actually created.
Here are the three factors that drive your ROI in residential real estate:
- Capital Invested (Leverage Impact): How much of your own money went in matters more than most realize. With a home loan, you use the bank’s money to amplify returns, something you can’t do with FDs or mutual funds in the same way.
- Cash-Flow Timing (Payments, EMIs, Rent, Exit): Real estate is not a one-time outflow. Down payment, EMIs, rental income and eventual sale all affect your actual returns.
- Exit Discipline (When You Sell): Even a good property can deliver poor returns if sold too early or too late. The right exit strategy often decides whether your ROI beats mutual funds or falls short.
Four Levers That Shape Your Real Estate Returns
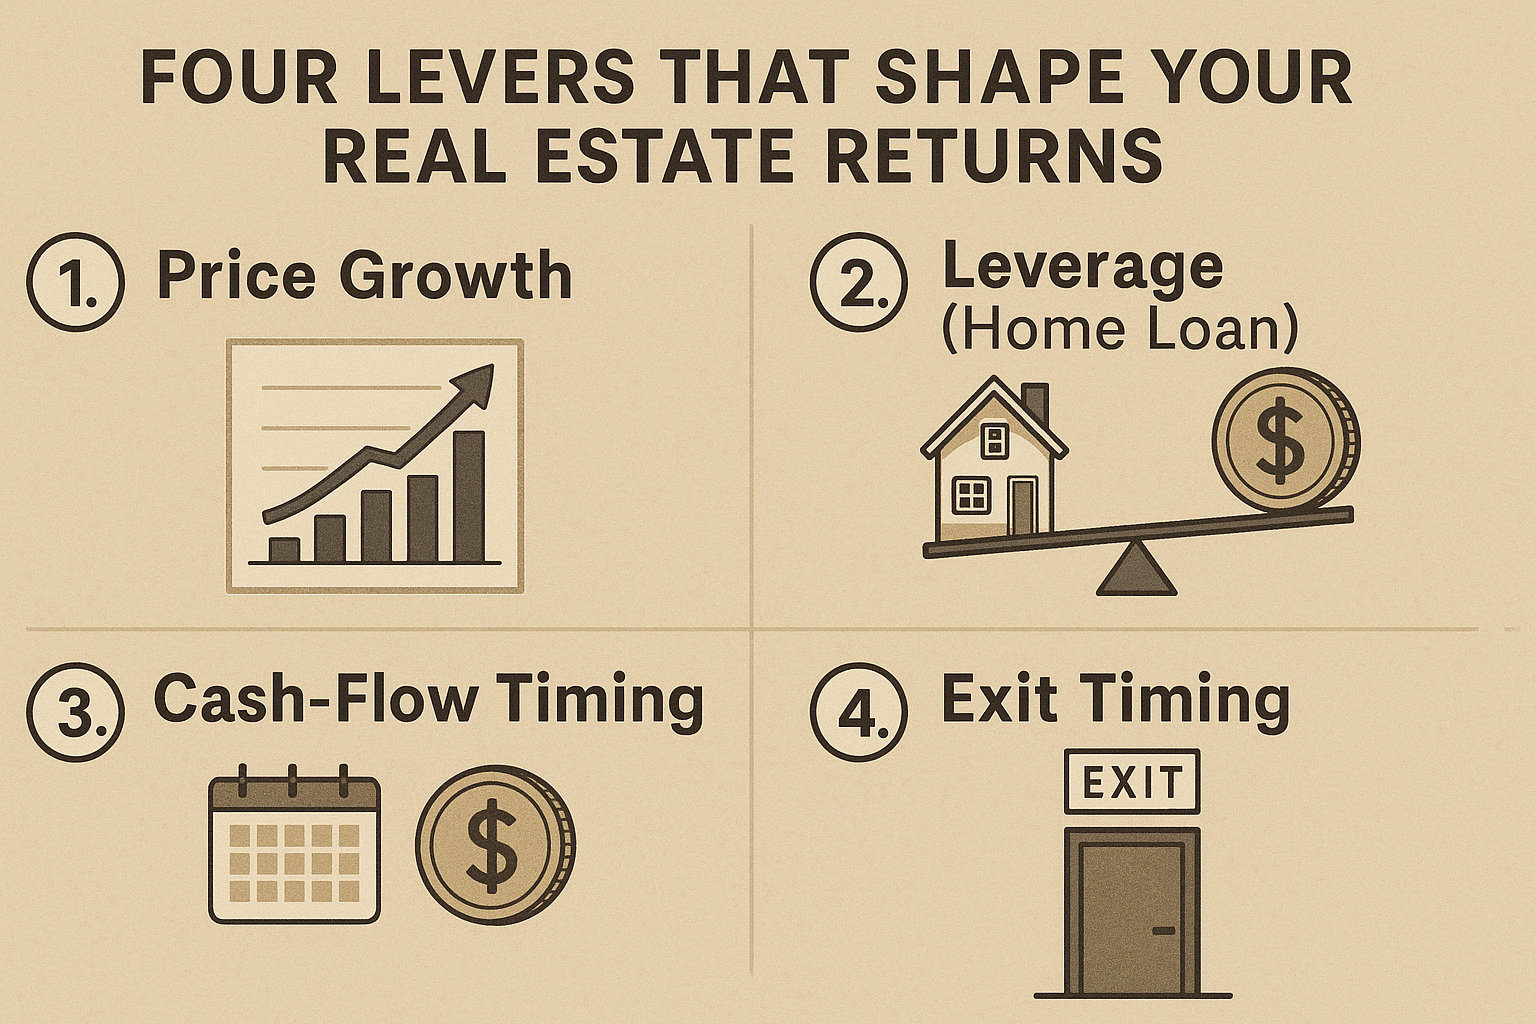
When people talk about returns from property, most stop at “prices went up.” In reality, your outcome depends on four moving parts working together:
1. Price Growth
This is the obvious one, how much the value of your property rises while you own it. Even steady growth of 5-7% a year can add up over time.
2. Leverage (Home Loan)
Real estate is one of the few assets where banks happily fund most of the purchase. That changes the math.
- If prices grow faster than your loan costs (interest + upkeep), your return on the money you put in jumps up.
- If they don’t, the same loan magnifies your loss.
3. Cash-Flow Timing
You commit money in stages: booking, construction-linked payments, EMIs, interiors and later you may get rent and finally the sale proceeds. The timing of these inflows and outflows decides how strong your returns really are.
4. Exit Timing
When you sell matters as much as what you bought. Even a few months here or there can change your returns, because EMIs and interest keep running whether or not prices move. Selling on impulse often erodes years of patient gains.
Five Numbers That Actually Matter in Real Estate Returns
When you invest in property, it’s easy to get lost in percentages. But if you want to truly understand your returns, just focus on these five numbers. They’ll give you the full picture:
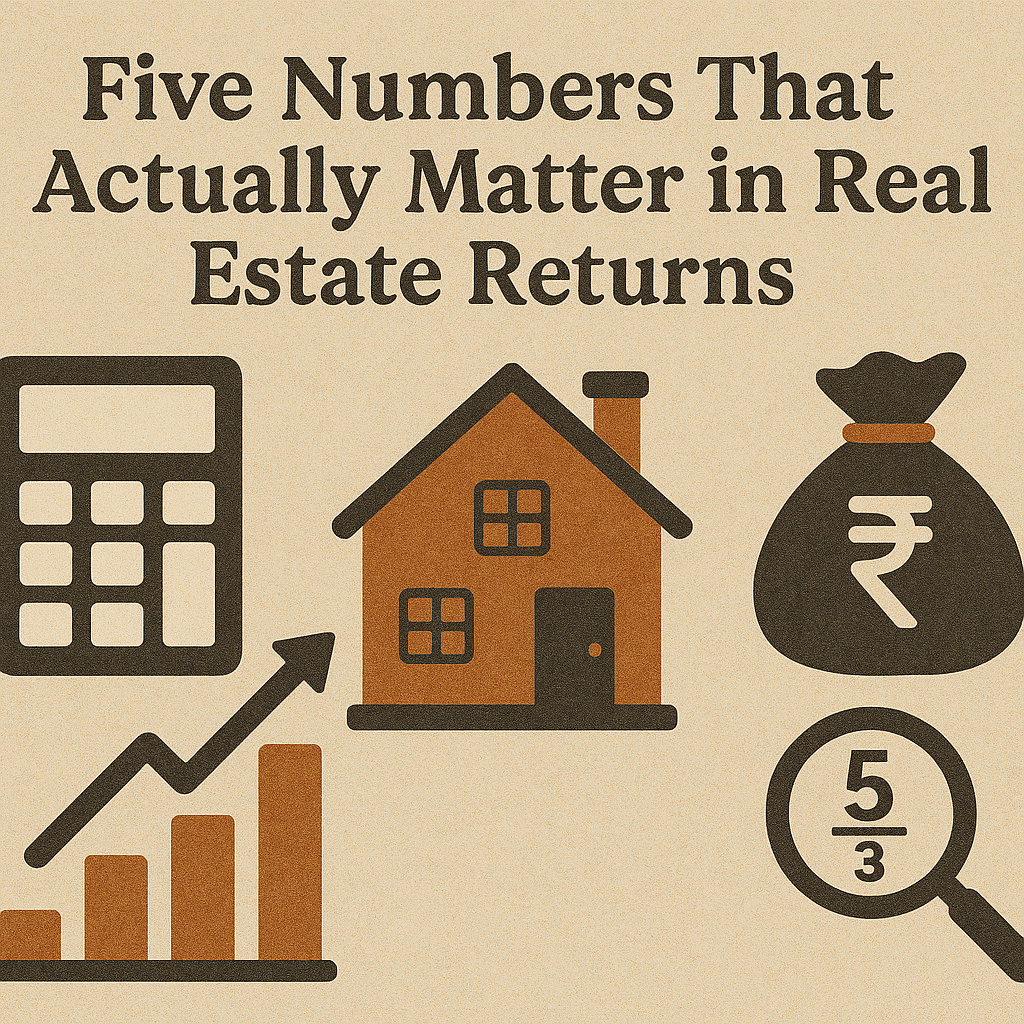
1. Leveraged IRR (Annual, Pre-Tax)
This is just a fancy way of asking: “After the loan, EMIs, rent and final sale, what yearly return did I get on my own money?” It’s basically your annualised return on the equity you invested.
2. Equity Multiple
For every ₹1 you put in, how much did you get back?Example: If you invested ₹10 lakhs and finally received ₹18 lakhs, that’s 1.8×. Simple, clear and easy to compare.
💡Cash back ÷ cash in
3. Absolute Profit (₹)
At the end of the day, it comes down to the profit you made. Even if percentages look small, the actual cash in hand might be significant.
4. Exit Price (₹)
This is the rate you sell at. A small difference, say selling at ₹7,200 per sq. ft. instead of ₹7,600 can completely change your overall profit.
5. Sale ÷ Purchase Rate
This is just the growth of the property itself (Exit price ÷ purchase rate). It shows how much the property appreciated, no matter how you financed it.
Always run your numbers in three versions:
- Pessimistic → if things don’t go your way
- Realistic → what you can actually expect
- Optimistic → if the market works in your favour
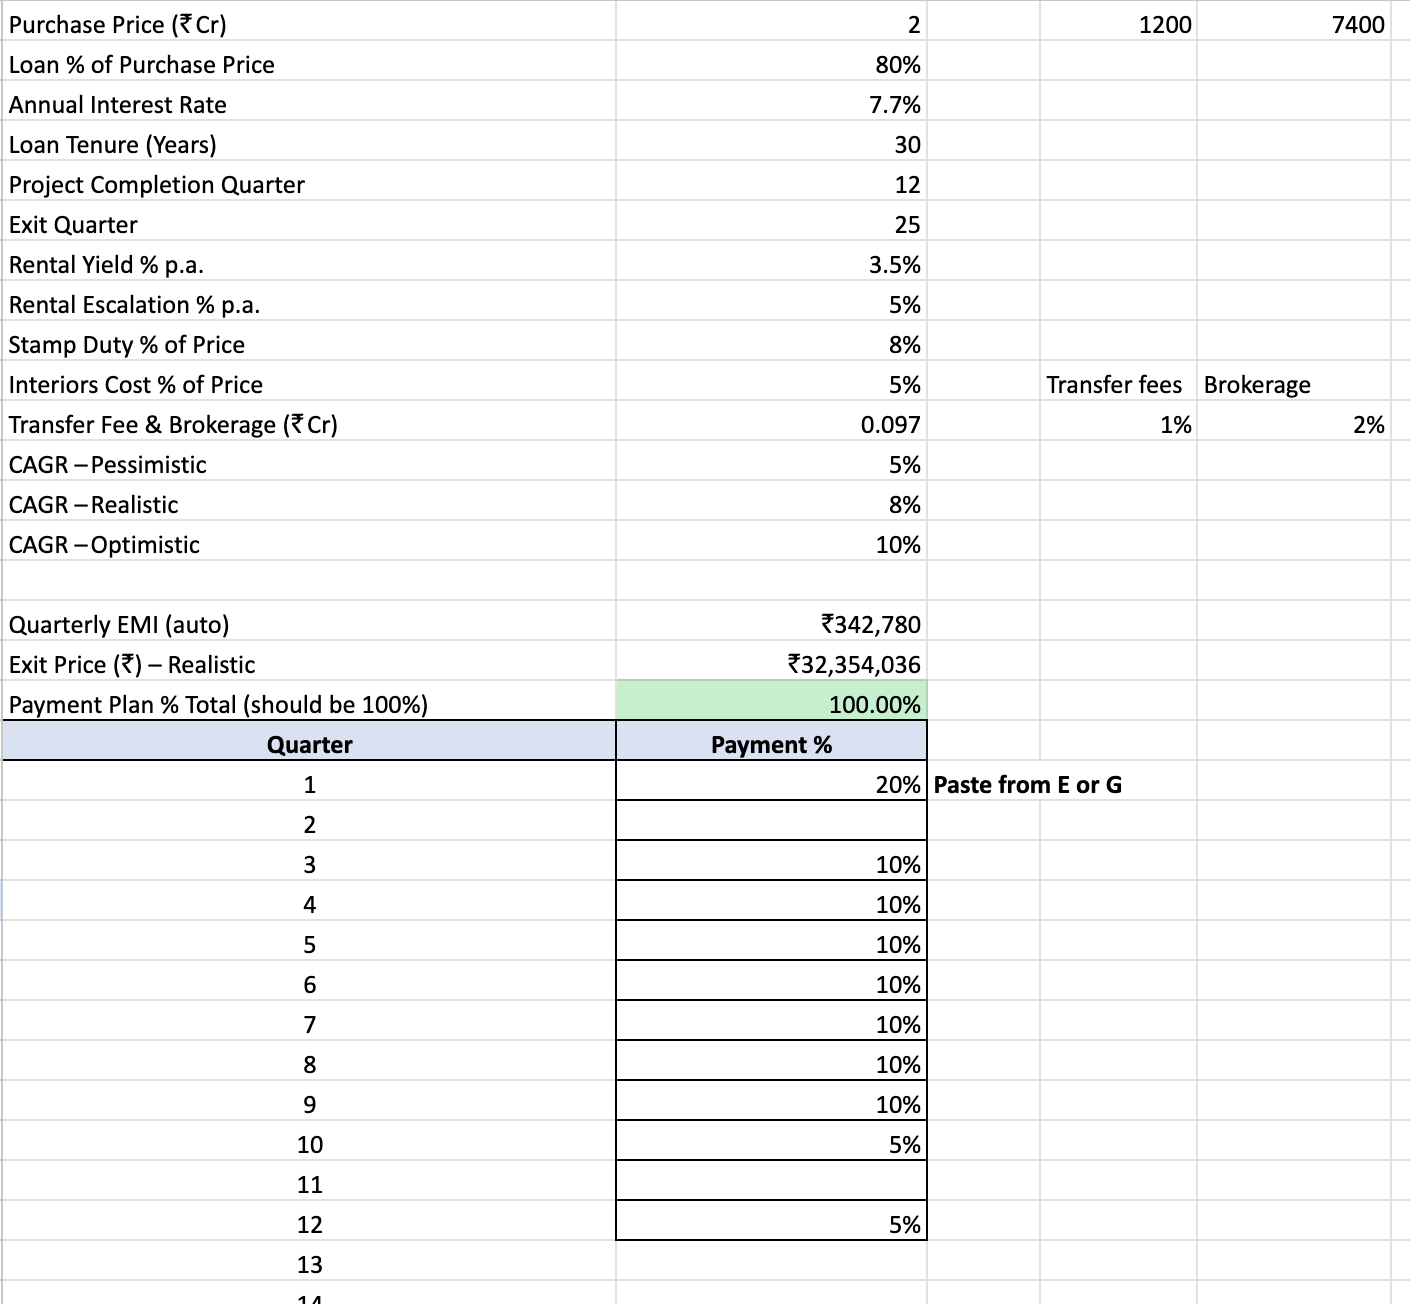
What to Consider When Calculating Real Estate Returns

Before you calculate your real returns, you need to feed in the right details. Here’s a simple checklist you can follow:
- Purchase Price (₹ Cr): The total cost of the property at the time of purchase.
- Loan %, Interest Rate and Tenure: How much of the property is bank-funded, at what rate and for how long.
- Project Completion & Exit Quarter: Note the quarter (Q1, Q2, Q3, Q4) when construction finishes and when you plan to sell. Thinking in quarters keeps your plan realistic instead of vague “years.”
- Rental Yield % p.a. and Rental Escalation % p.a.: Once you have possession, what annual rent can you expect and how much should it grow every year?
- Stamp Duty % and Interiors Cost %: Add-on costs near the time of purchase that buyers often forget.
- Transfer Fee & Brokerage (₹): The transaction costs you’ll pay when you eventually exit.
- CAGR Scenarios (Pessimistic / Realistic / Optimistic): Your three growth assumptions for property value. Stress-testing your numbers across these helps you stay prepared.
Once you plug these in, your calculator should automatically give you:
- Quarterly EMI (so you know the exact outflow)
- Exit Prices under each scenario
- A simple cash-flow ledger showing when money goes out and when it comes in
For Instance:
Let’s take a simple example of a Bangalore property investment to see how numbers play out in real life.
- Purchase Price: ₹2.00 Cr
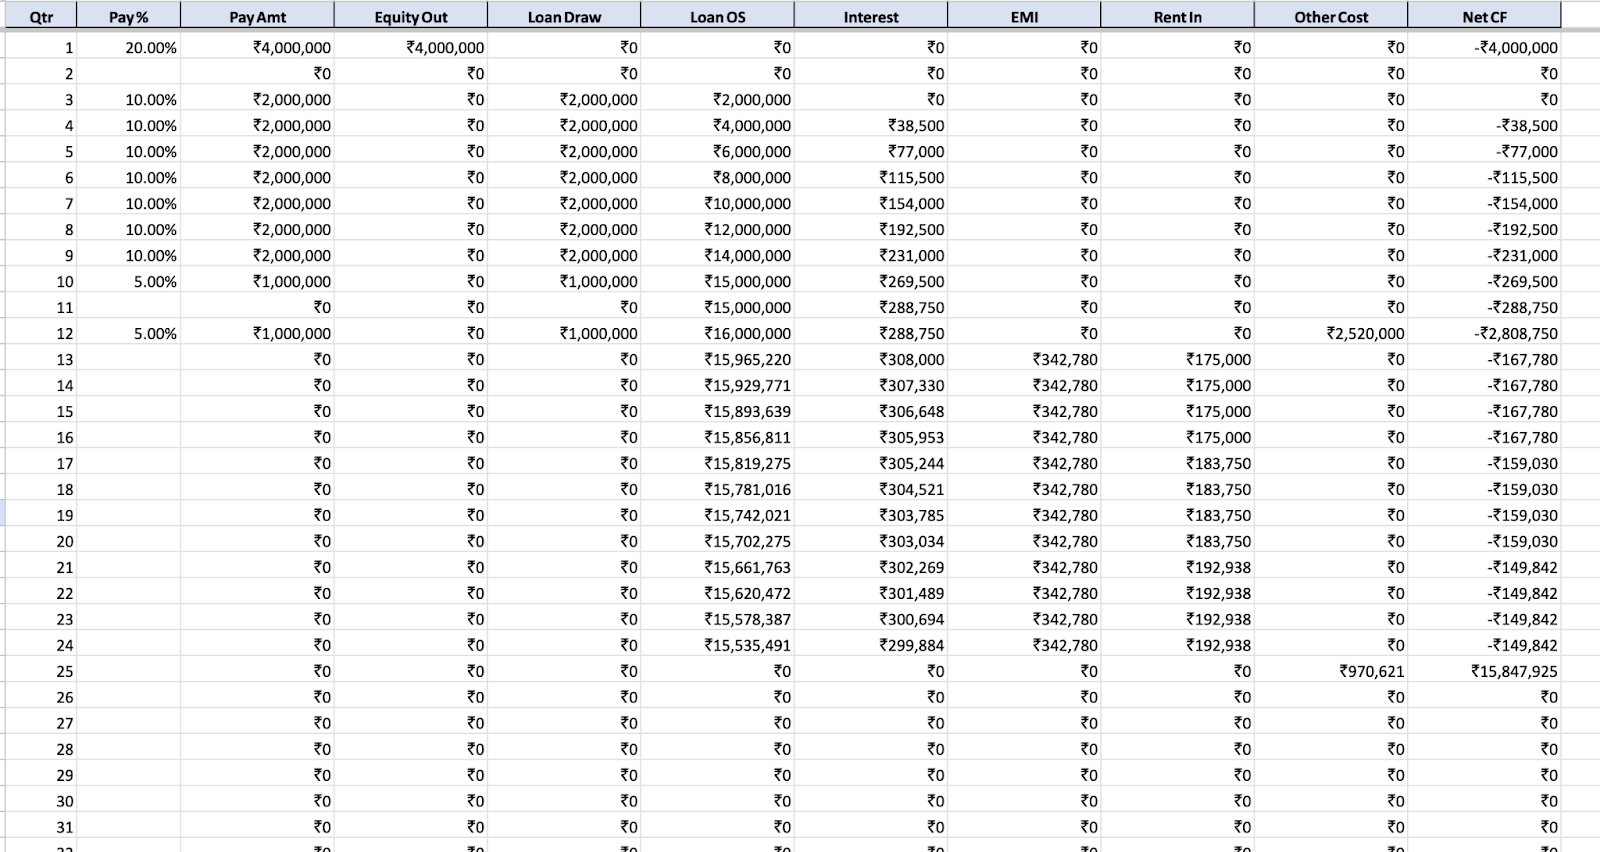
- Holding Period: 13 Q (from construction to exit, based on the above image: completion in Q12, exit in Q25)
Now, let’s see how your exit value changes under different CAGR assumptions:
- Pessimistic (5% CAGR): Exit ≈ ₹2.67 Cr (Sale ÷ Purchase ≈ 1.34×)
- Realistic (8% CAGR): Exit ≈ ₹3.23 Cr (≈ 1.62×)
- Optimistic (10% CAGR): Exit ≈ ₹3.67 Cr (≈ 1.83×)
What Happens with a Loan?
Suppose you take an 80% loan, your own equity invested is much lower (roughly 30-35% of total cost after adding stamp duty and interiors).
If property growth is near the 8-10% CAGR band, your Leveraged IRR can jump into double digits, which is much higher than all-cash buying.
But if growth stays closer to 5% CAGR, leverage starts working against you because your loan interest + carry costs eat into returns.
Key Takeaway
Leverage is a double-edged sword. It can boost your returns when markets do well, but it can also magnify risk when growth slows. Always keep a buffer for delays, flat periods, or unexpected costs, over-leveraging can turn a good deal into a stressful one.
How Money Actually Flows in a Property Investment
One mistake many first-time buyers make is only thinking about the “buy price” and “sell price.” In reality, real estate has its own rhythm of money flowing in and out. Here’s what typically happens:
During Construction
- You pay according to the builder’s payment plan (it always adds up to 100%).
- The bank disburses your home loan in stages linked to construction progress.
- You usually pay pre-EMI, interest only on the portion of the loan already disbursed.
At Possession
- Your full EMI (principal + interest) begins.
- If you put the property on rent, you start earning rental income. Remember to factor in annual escalation (usually 5-7% per year) and adjust for possible vacancy or maintenance costs.
At Exit (Sale)
- You receive the sale proceeds from the buyer.
- From this, you pay brokerage and transfer fees and settle any remaining loan balance.
- What’s left is your equity cash back, your original investment plus profit (if the numbers worked in your favour).
Quick Investor Checklist Before You Say “Yes”
Before locking in a residential property investment in Bangalore (or anywhere), run through this short checklist.
- Three scenarios side-by-side: Always check Pessimistic, Realistic and Optimistic cases. Don’t rely on just one growth assumption.
- Exit sensitivity: What happens if you sell 2 quarters earlier or later? Even small shifts can change returns because EMIs and loan interest don’t stop.
- All costs included: Stamp duty, interiors, brokerage/transfer fees, plus rental vacancy and maintenance. Missing these leads to inflated ROI.
- EMI start aligned to possession: Make sure your calculator models the real start of EMI, not just the booking date.
- Payment plan totals 100%: Obvious, but easy to miss when multiple stages and charges are involved.
- Rent modelled properly: Add annual escalation (typically 5-7% p.a.) and account for occasional vacancy.
- Leverage check: After adding all carry costs (interest + upkeep), does the loan still improve your return? If not, scale down leverage.
Common Mistakes Property Investors Make (and How to Fix Them)
Even smart investors slip up when evaluating residential real estate. Most of these mistakes come from oversimplifying the math or relying on averages. Here are the big ones and how to avoid them:
- Only quoting “area CAGR”
- Fix: Don’t just look at average price growth in a location. Model your actual cash flows because sub-market averages won’t pay your EMIs.
- Ignoring timing
- Fix: A great entry price can still lead to weak returns if your cash flows (payments, EMIs, rent, exit) are poorly timed. Always stress-test different entry and exit quarters.
- Forgetting exit costs
- Fix: Brokerage and transfer fees can quietly eat into your profits. Add them right from the start so your numbers aren’t inflated.
- Counting rent too soon
- Fix: Rental income starts only after possession. Factor in a few months of vacancy and maintenance to stay realistic.
- Comparing by sticker price
- Fix: Instead of asking “What’s the price per sq. ft.?” compare properties by Leveraged IRR and Equity Multiple. That’s what actually shows you if your money is working harder.
Don’t DIY your returns, Propsoch has already done the math
Crunching numbers for real estate can get messy fast. Between EMIs, rent, stamp duty, interiors, and exit costs, a simple Excel often misses the bigger picture. That’s why we built the Propsoch Returns Engine so you don’t have to.
With our Guided Homebuying (GHB) Program, we model your deal end-to-end:
- Every stage from purchase to exit stage is covered, booking, possession, rent and eventual sale.
- Localised assumptions: Based on your city, micromarket, builder and realistic timelines.
- Clear return metrics: Leveraged IRR, Equity Multiple, and Absolute Profit, shown across pessimistic, realistic and optimistic cases.
- Sensitivity checks: What happens if possession is delayed? Or rent dips? Or exit shifts by two quarters? You’ll see it all upfront.
Sign up for GHB and let our smart returns calculator + expert team give you answers tailored to your purchase.
Sign Up for Guided Homebuying Program
Let our smart returns calculator + expert team give you answers tailored to your purchase.
Click Here